A Shopify KPI Dashboard That Tracks Goals, Not Just Numbers
Real-time revenue, order, and profit KPIs with 30-day comparisons, plus OKR-style goal tracking calculated live from your actual sales data.
KPI cards that adapt to what data you actually have
SnapDash's KPI dashboard doesn't force every store into the same four metrics. If you haven't connected an ad platform, you see order count and total expenses instead of ROAS and ad spend — so the numbers on screen are always ones you can act on.
- Revenue, profit, and order KPIs from real data
- 30-day period-over-period comparisons
- Goal & OKR tracking with automatic status
- KPI cards adapt to your connected integrations
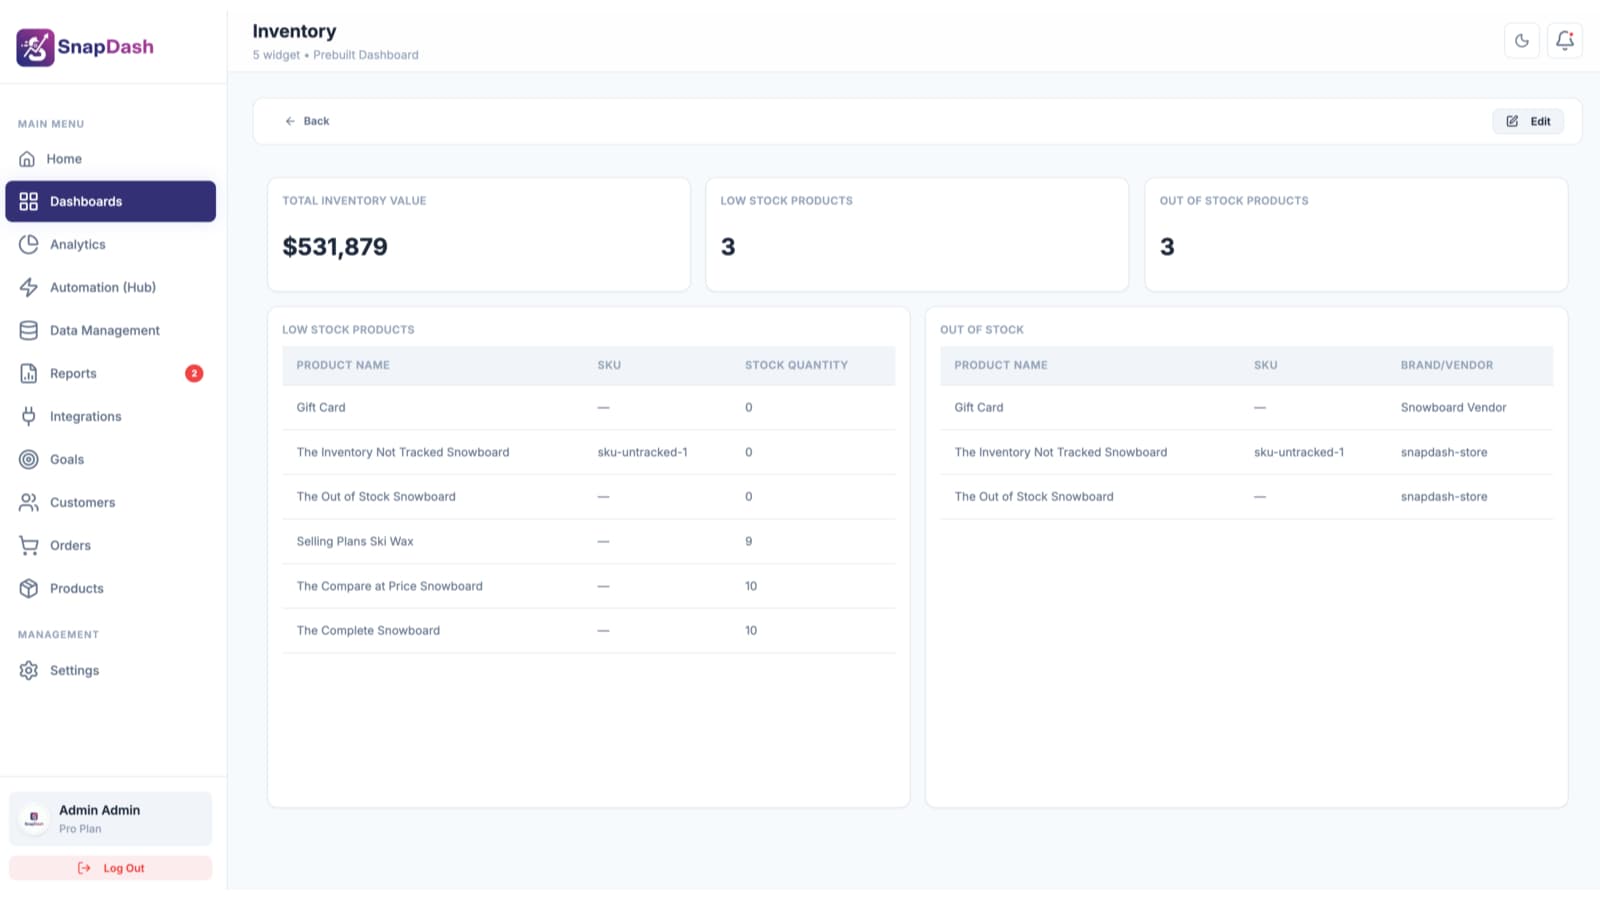
What's on your KPI dashboard
| KPI Card | How It Works |
|---|---|
| Total Revenue | Labeled by connected source, e.g. "Total Revenue (Shopify + Google Ads)", calculated from real order data. |
| Net Profit | Revenue minus ad spend and product cost, for stores with a connected ad integration. |
| Orders / Total Expenses | Shown when no ad integration is connected, so the KPI row always reflects what data you actually have. |
| ROAS / Ad Spend | Shown automatically once an ad platform is connected — no manual toggle required. |
Turn KPIs into targets your team can hit
Revenue Goals
Set a target and see live progress calculated from real order totals in your selected date range.
New Customer Goals
Track new customer acquisition against a target, updated automatically as new customers place orders.
Repeat Purchase Rate
Monitor what share of customers in a period placed more than one order — a core retention KPI.
ROAS & Custom Goals
Define a custom metric or ROAS target for cases where ad spend data isn't yet connected, and update progress manually.
30-Day Period-over-Period
Every KPI card compares the current period to the previous one, with a percentage change badge so trends are obvious at a glance.
Status Auto-Updates
Goals are automatically marked On Track, At Risk, Off Track, or Completed based on real progress — no manual status updates.
Shopify KPI dashboard questions, answered
Need customer-level metrics too? See automated Shopify insights.
Revenue, net profit, order count, and total expenses are calculated directly from Shopify order data. ROAS and ad spend KPIs appear automatically once an ad platform is connected.
Revenue, new customer, and repeat purchase rate goals calculate progress live from real Shopify order and customer data for your selected time period. ROAS and custom goal types require manual updates since they depend on ad spend data.
Yes. KPI cards include 30-day period-over-period comparisons by default, and analytics views let you switch between 7, 30, and 90-day ranges.
Goals can be set for Monthly, Quarterly, or Annual periods, with a custom start and end date and a target value in currency, percentage, count, or multiplier units.
No — ROAS depends on ad spend data, so it only appears once Google Ads or another supported ad platform is connected. Without that connection, SnapDash shows order count and total expenses instead.
Yes. KPI dashboards and goal tracking are included in SnapDash at no cost during our public launch.
Explore the rest of SnapDash
Every part of SnapDash connects to the rest — see how each piece fits together.